Analyze
Models and Data of the Solar System
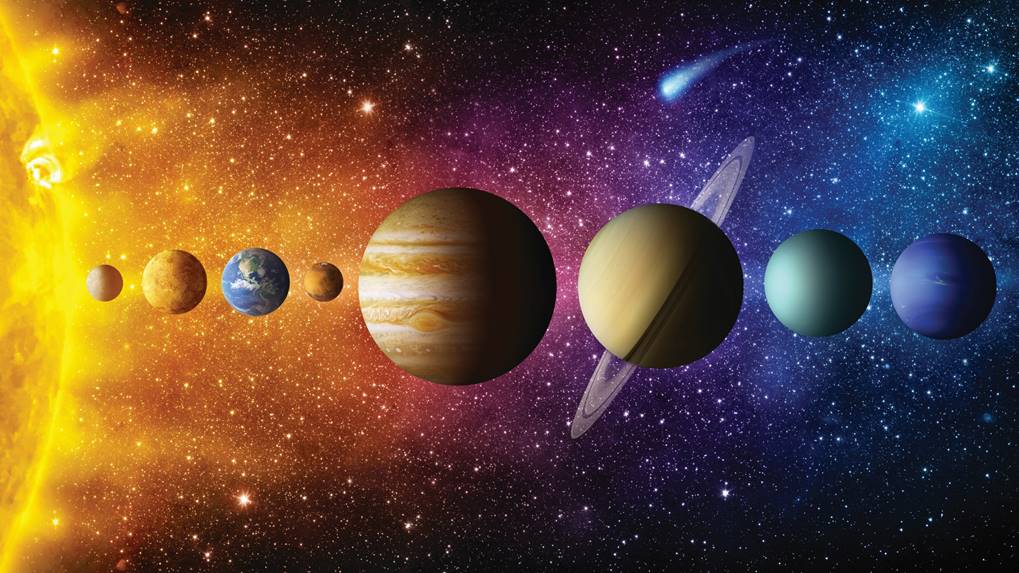
Our solar system consists of the Sun and all objects that
orbit it. These objects encompass planets, moons, asteroids, and comets.
Comprehending the actual sizes of these celestial bodies
can be challenging without using data
and a model.
Learning
Objectives
This unit will equip you with the knowledge and
skills to analyze planetary data and models. You will learn how to collect,
interpret, and compare data about the characteristics of various planets, such
as their size, distance from the Sun, and surface features.
Analyzing
Planetary Data
Let's imagine you're a detective trying to
solve a mystery. Your clues are like pieces of data. The more clues you gather,
the more you understand the mystery and the closer you get to solving it.
That's how data works in science.
Data is important in science because it gives
us clues about the world. Scientists observe things, take measurements, and
perform experiments to collect data. It's like gathering clues to understand a
big mystery.
For example, if a scientist is studying climate
change, they might collect data about temperatures around the world over many
years. This data would show them patterns and trends, like whether the Earth is
getting warmer or cooler.
Scientists use data to make better decisions
and more accurate predictions. It helps them test their ideas and determine
whether they’re right. With data, scientists would be guessing.
So, using data in science is like being a
detective - it helps scientists solve the mysteries of the universe!
In this section, you will learn how scientists
collect data and compare various
features of planets. Data can be
defined as information or facts that are collected, stored, and analyzed to
gain knowledge or make informed decisions. So, wear your space helmets and
prepare for an intergalactic adventure!
1. Collecting Planetary Data: We must gather information about the
planets before analyzing data. Scientists use various tools and technologies to
collect data, including telescopes, space probes, and satellites. They observe
the planets' sizes, distances from the Sun, atmospheres, surface features, and
more. Scientists can create a comprehensive picture of each planet by studying
these aspects.
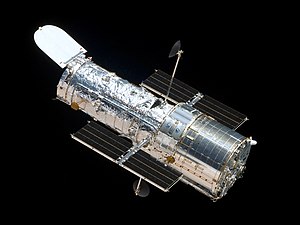
Hubble Space
Telescope
2. Comparative Analysis: Once the data is collected, it's time to
compare the properties of different planets. Scientists organize the
information in charts, graphs, and tables to make it easier to understand and
analyze. For example, they might create a table comparing the sizes of planets
or a graph showing the distances of planets from the Sun. These visual
representations help scientists identify patterns and make meaningful
comparisons.
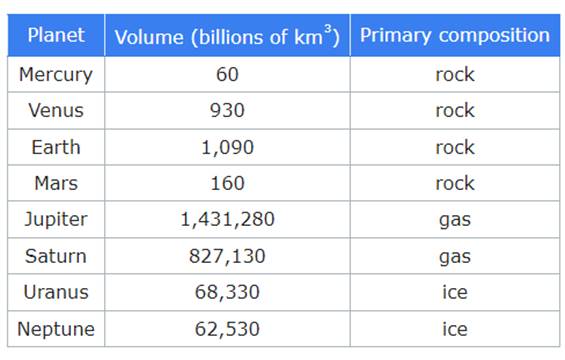
Data Table
3. Size Matters: One way to compare planets is by their sizes.
Scientists measure each planet's diameter and rank them from smallest to
largest. By doing this, we discover that Mercury is the smallest planet, while
Jupiter is the largest. It's fascinating to see how the sizes of the planets
vary and how they relate to one another.

Data Chart
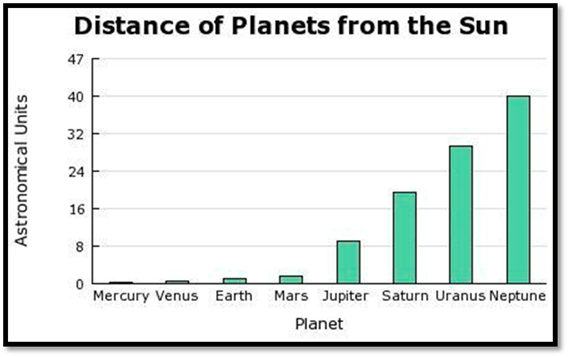
4. Distances from the Sun: Another aspect to explore is the
distance of each planet from the Sun. Scientists measure this distance using
astronomical units (AU), the average distance between the Earth and the Sun.
When we compare the distances of the planets, we find that Mercury is the
closest planet to the Sun, while Neptune is the farthest. It's interesting to
see how the planets are arranged in our solar system based on their distance
from the Sun.
Data Graph
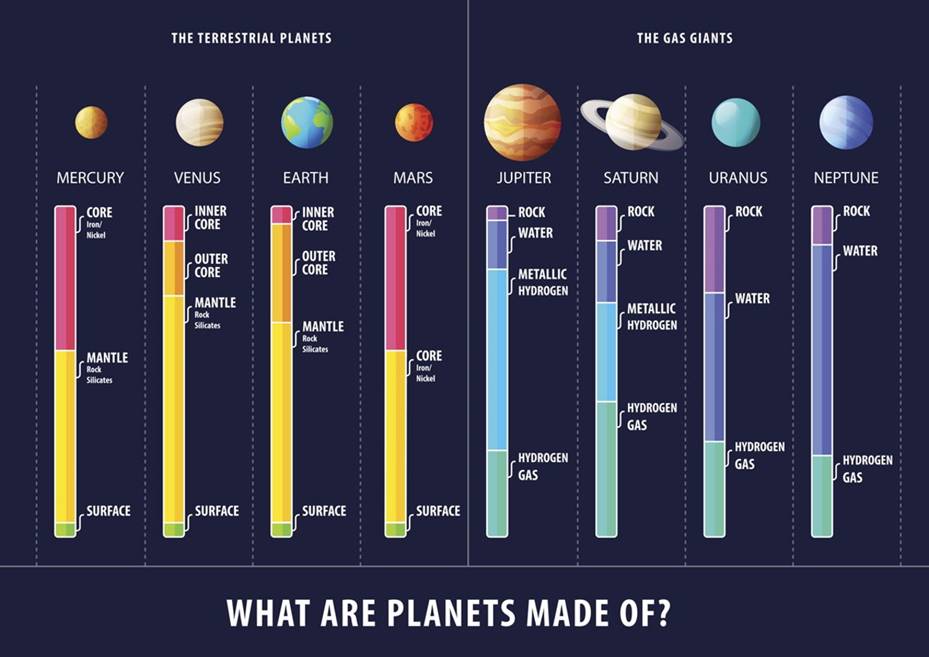
5. Surface Features: Planets have unique surface features that set
them apart. Some have mountains, valleys, and craters, while others have vast
plains or icy landscapes. Scientists analyze images and data to learn more
about these features and compare them among different planets. For example,
Mars has giant volcanoes and a canyon called Valles Marineris, while Venus has
a thick atmosphere and a rocky surface.
Analyzing data allows scientists to compare
planets' properties and uncover our solar system's wonders. By studying the size,
distance from the Sun, and surface features, we can appreciate the diversity of
planets and how each is special. So, keep exploring, and who knows? One day
you'll become a planetary scientist and make your discoveries about the
mysteries of the universe!
Analyzing
Models of the Solar System
Have you ever looked at a map, a globe, or a
drawing? These things are created to show stuff that's either too big to fit in
a room or too tiny to see with just your eyes.
In science, these maps, globes, and drawings
are called models. Scientists use
them to show different scientific concepts.
Think about it this way. Scientists use a globe
to represent Earth because we can't just zip into space whenever we want to
look at our planet. They use models of cells too, because cells are too small
to see without a microscope.
Sometimes, scientists use models to show things
that might be too dangerous or impossible to do in real life. For example, a
model can show you what's inside a volcano. That's cool, but you should avoid
stepping into a real volcano!
Models are instrumental in simplifying specific
aspects of a system, making them more understandable.
They can be a physical object, a graph, a
diagram, or even a simulation.
Size and Distance
Below is a diagrammatic model that illustrates
the relative sizes of the Sun, the Earth, and the Moon. In this model, Earth
and the Moon are represented by two small dots, showcasing their accurate
proportions compared to the Sun. An enlarged view of Earth and the Moon provides
a better perspective.
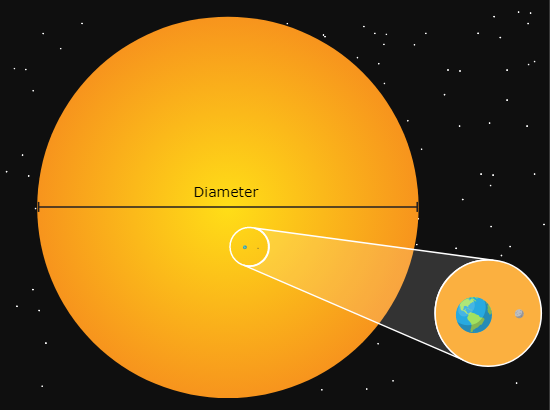
In the given model, both the Sun and the Earth
are represented as spheres. A sphere's diameter is the straight-line distance
from one side of the sphere to the other, passing through its center. Using
this model, you can estimate how many times the Earth's diameter would fit into
the Sun's.
In the model, the Sun's diameter is symbolized
by a black line, whereas the diameter of the Earth is equivalent to the width
of the dot that represents the Earth.
If a model showed every object in the
solar system, the model would be hard to understand. Scientists often show
certain characteristics in a model and leave out others. A characteristic that
is left out is called a limitation of the model.
Movement and
Interaction
Beyond illustrating size and distance, models
can also demonstrate the movement and interaction of objects within the solar
system. As an example, the model below employs arrows to indicate motion. These
arrows represent the orbits of the Earth and the Moon around the Sun. The grey
lines in the model symbolize the trajectories followed by both the Earth and
the Moon.
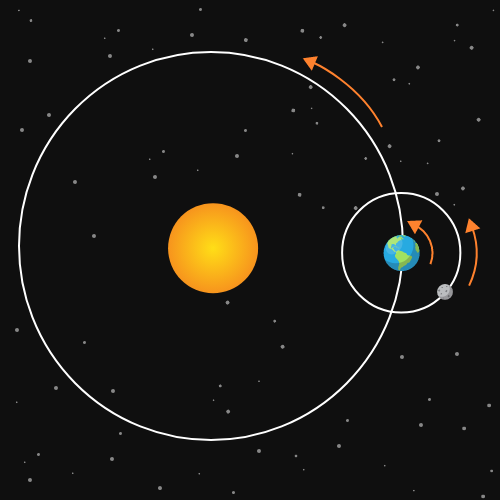
Earth moves in a repeating path around the
Sun. An orbit is an object's
regular, repeating path as it moves around another object. Most planets move in
a nearly circular orbit around the Sun. The model shows that the Moon
orbits the Earth, and Earth orbits the Sun. It takes one year for Earth to
orbit the Sun once. During this time, the Moon orbits Earth about
12 times.
Exploration
Explore
3D models of all the planets and brush up on facts regarding each planet's
location, size, and composition.
Click the link below.
